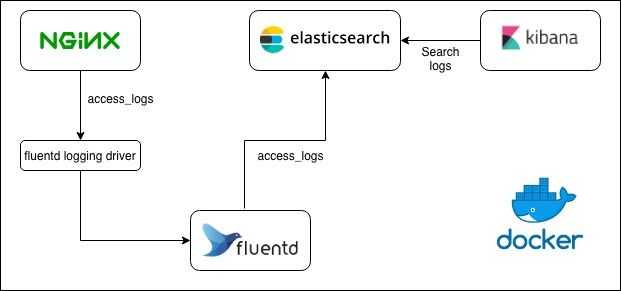
This is an example on how to ingest NGINX container access logs to ElasticSearch using Fluentd and Docker. I also added Kibana for easy viewing of the access logs saved in ElasticSearch.
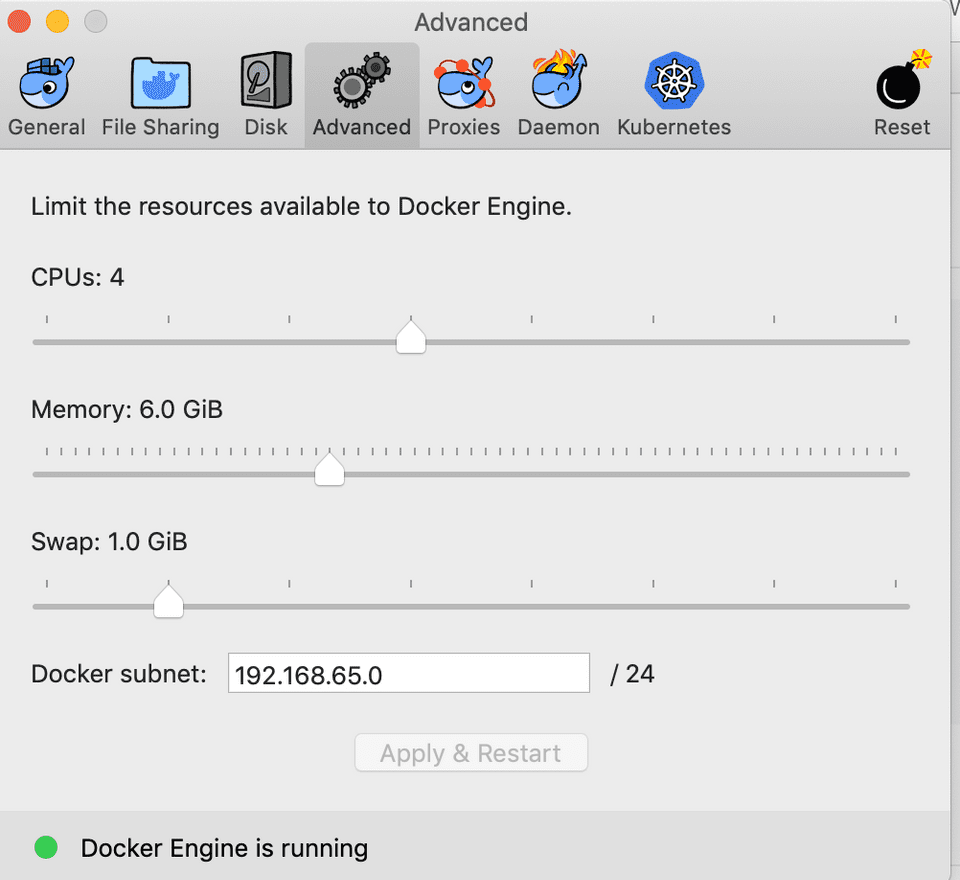
I noticed that ElasticSearch and Kibana needs more memory to start faster so I’ve increased my docker engine’s memory configuration to use 6GB. I am using version 2.0.0.0-mac78 (28905) of Docker CE in a Mac.
I’ve prepared the compose file “docker-compose.yml” for this example. All files are also available in my github repo. The compose file below starts 4 docker containers ElasticSearch, Fluentd, Kibana and NGINX. I wasn’t able to find a Fluentd docker image which has the ElasticSearch plugin built-in so I just created a new docker image and uploaded it to my dockerhub repo. The Dockerfile for the custom fluentd docker image can also be found in my github repo.
The compose file also creates a volume for ElasticSearch so you don’t lose data when you restart the ElasticSearch container. It also creates a new network named “logging-net” where all the containers will be communicating. For the example to work, we need to configure Fluentd as the logging driver of our NGINX container.
    logging:
      driver: fluentd
      options:
        fluentd-address: localhost:24224
        tag: httpd.access
docker-compose.yml
version: "3.3"
services:

  elasticsearch:
    image: 'docker.elastic.co/elasticsearch/elasticsearch:6.5.1'
    ports:
      - "9200:9200"
      - "9300:9300"
    volumes:
      - elasticsearch-vol:/usr/share/elasticsearch/data
    networks:
      - logging-net
    environment:
      - xpack.security.enabled=false

  fluentd:
    image: melvindave/fluentd-elastic:1.0
    ports:
      - "24224:24224"
    networks:
      - logging-net
    depends_on:
      - "elasticsearch"
    volumes:
      - ./fluentd/etc:/fluentd/etc

  kibana:
    image: 'docker.elastic.co/kibana/kibana:6.5.1'
    ports:
      - "5601:5601"
    networks:
      - logging-net
    depends_on:
      - elasticsearch

  nginx:
    image: nginx
    ports:
      - "80:80"
    networks:
      - logging-net
    deploy:
      replicas: 1
    volumes:
      - ${NGINX_HTML_DIR}:/usr/share/nginx/html
    logging:
      driver: fluentd
      options:
        fluentd-address: localhost:24224
        tag: httpd.access
    depends_on:
      - "fluentd"

networks:
  logging-net:

volumes:
  elasticsearch-vol:
To run the example, you need to set an environment variable to point to the root directory where you want NGINX to serve your html files from. If you want to use the sample index.html in the repo, just execute this command.
$ export NGINX_HTML_DIR=./nginx-files/Once you’ve got the environment variable configured, you can now run all the containers using this command.
$ docker-compose up -dYou’ll see a similar output like below.
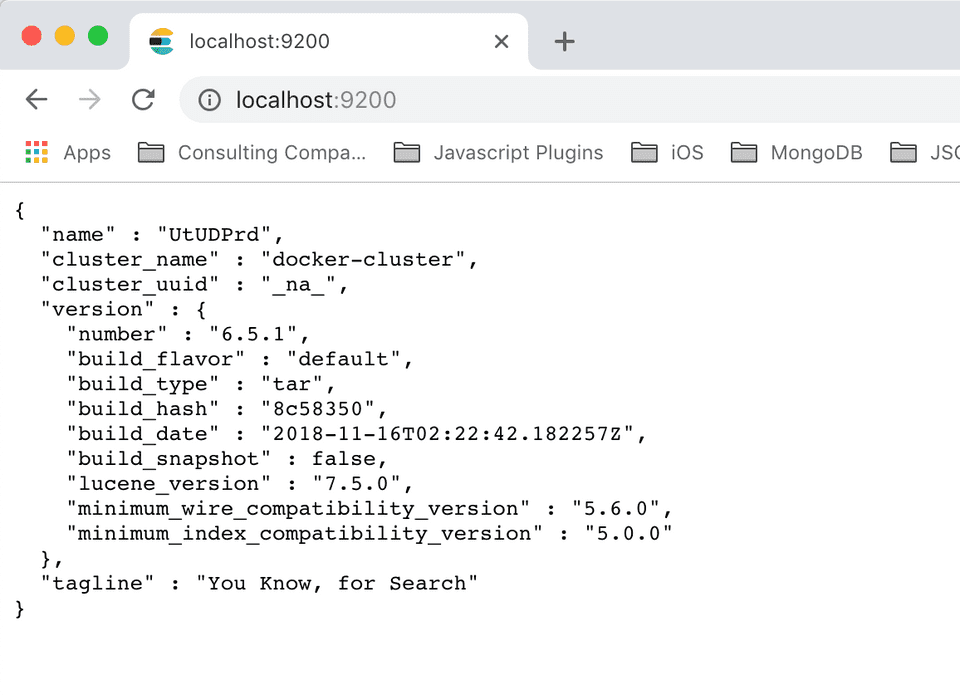
Wait a few minutes since ElasticSearch and Kibana takes some time to startup. You can constantly check if ElasticSearch is up by accessing it from the browser.
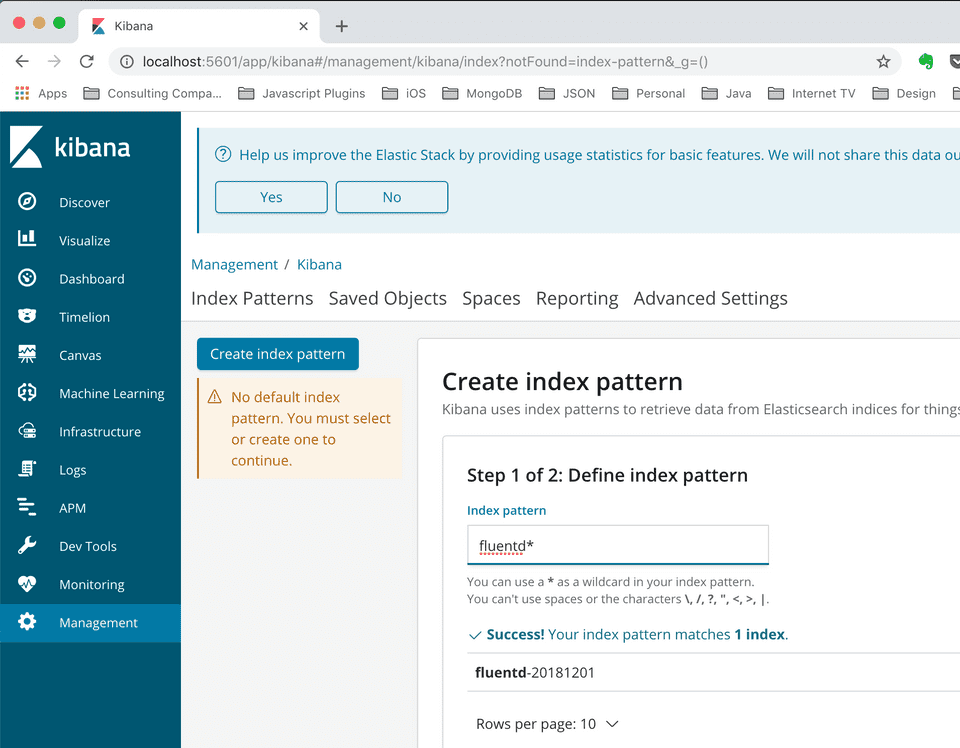
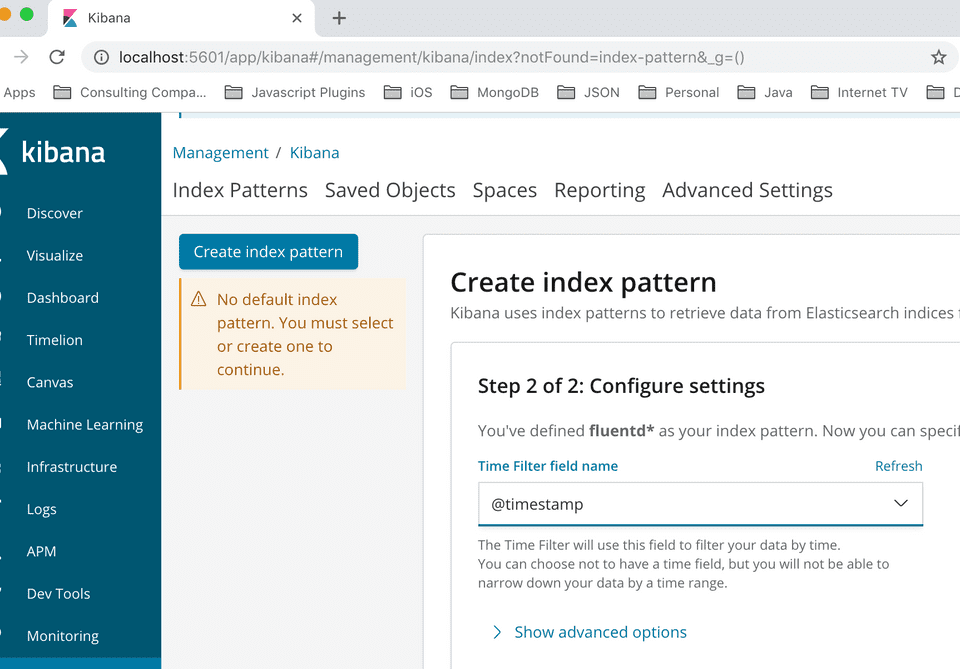
Once Kibana is up, you need to create an index pattern to be able to see the NGINX access logs. In the fluentd configuration we used fluentd as the prefix by configuring logstash_prefix.
<source>
  @type  forward
  port  24224
</source>

<filter **>
  @type stdout
</filter>

<match *.**>
    @type copy
    <store>
      @type elasticsearch
      host elasticsearch
      port 9200
      logstash_format true
      logstash_prefix fluentd
      logstash_dateformat %Y%m%d
      include_tag_key true
      type_name access_log
      tag_key @log_name
      flush_interval 1s
    </store>
</match>
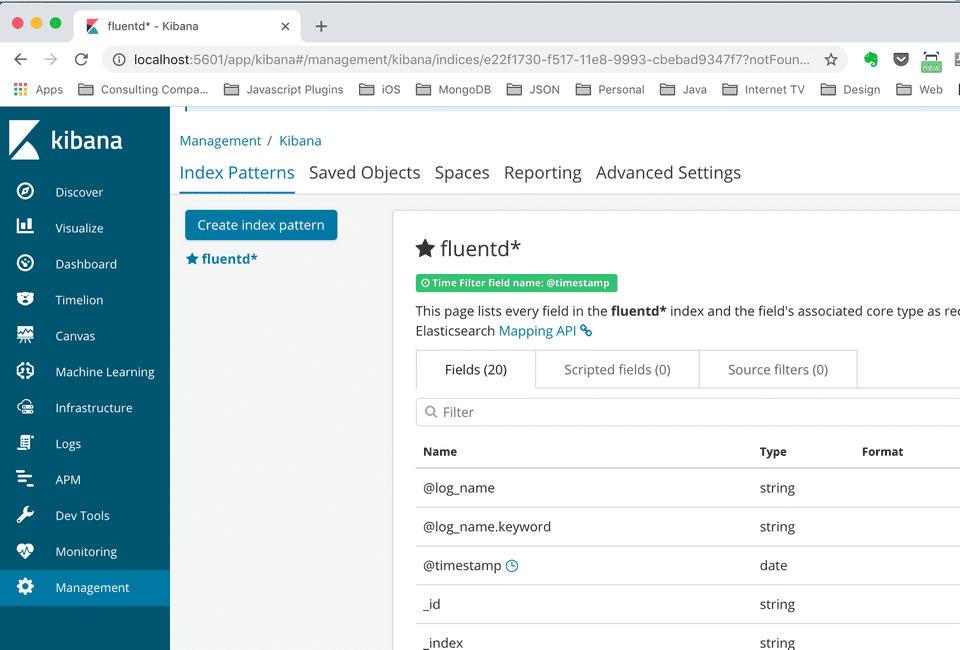
So let’s proceed to create the index pattern in Kibana. Use fluentd* to capture all indices prefixed with fluentd.
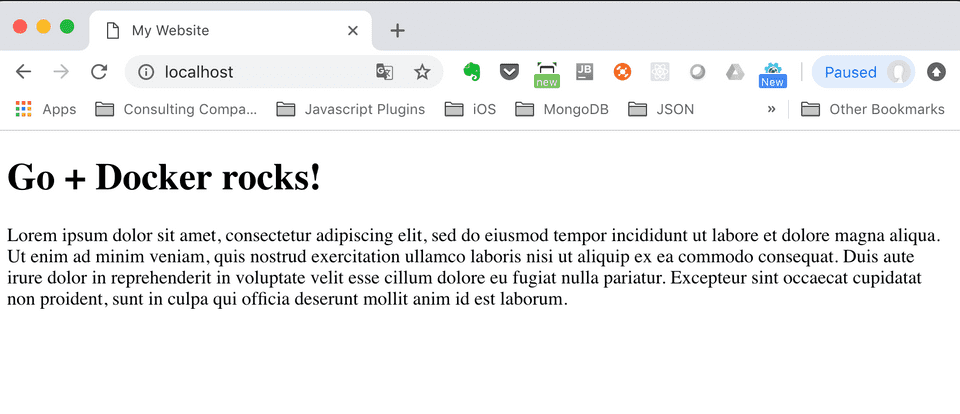
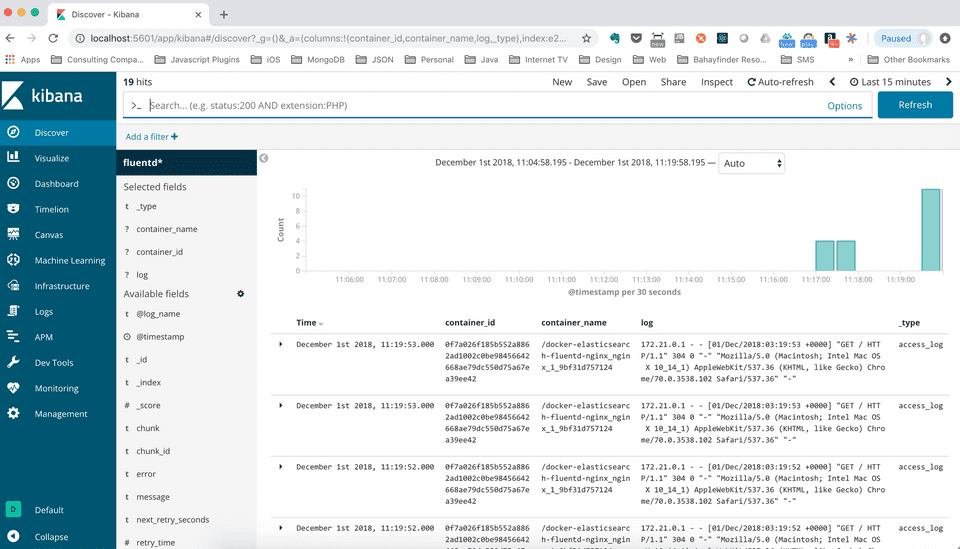
Initially, we won’t see any NGINX access logs in Kibana because we haven’t really accessed Nginx. To access NGINX, just go to http://localhost from your browser. We’ve configured NGINX to run in its default port 80 so the port in the URL is not required. Once we’ve accessed the default page we created, we would start seeing access logs in Kibana.
Here’s how the log entries would look like in Kibana.
That’s it! Hope you find it useful!
For more updates, you can follow my blog and Twitter @donvito. Most of my tweets are about Docker, Kubernetes, GoLang, Cloud, DevOps, Agile and Startups. I also share code in my GitHub. If you want to know more about what I do, please add me in LinkedIn. I recently started a new youtube channel - I upload some tutorials there. Check it out!
